Specifications & References

The AutoVysion instrument determines the affinity constants and the concentration of antibodies/antigens in one single step.

In less than 30 minutes. Minimal training is needed. The software allows to focus you fully on your actual biochemical program tasks while the system runs the instrument and presents the results and evaluation.

The AutoVysion SPR Instrument provides ease of use and shortens your time to results:

  • No programming skills needed.
  • Always the right conditions for determining kinetics and concentration in one run.
  • Every technician can operate the instrument. Just 30 minutes needed for training.
  • Relatively cheap with very low procurement, maintenance and usage costs.
  • Standardization.
  • Data interpretation and export of data made easy.
  • No auto sampling or other complicated systems: just inject and read. 

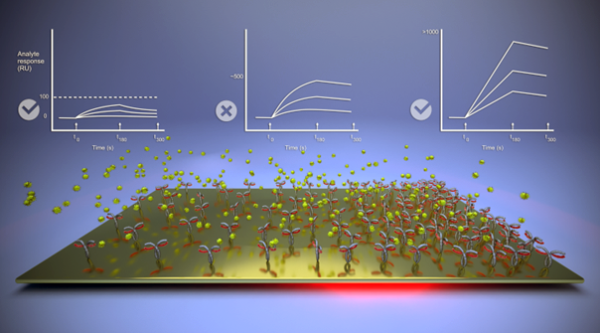
Microfluidic design and scripts generates a pre-determined assay set up. The AutoVysion has two parallel flow channels that can be used separately, if wished so. We recommend one sensor chip, the Streptavidin sensor chip. Other chips are available. 
Vysion 2

AutoVysion Application Data

  • Dual channel (independently) detection on a ligand density gradient.
  • Small sample volume (70 μL). 
  • No labels or pretreatment of samples required.
  • No specific training required.
  • Unparalleled analytical capabilities in biomolecular interactions.

AutoVysion Hardware & Software

  • Continuously filming the reflectivity conditions of the entire sensor (based on SPR-imaging).
  • Storing a stack of images for analyzing the sensorgrams from hundreds of Region of Interests.
  • Proprietary dual cuvette injection flow (CIF) channels.
  • All scripts are pre-set and self explaining – no need to understand underlying techniques.
  • Additional  patent pending continuously ligand gradient for both channels.
  • 8-Port syringe pump with connections to  immobilization-, running buffer, regeneration solution and waste vessel. 4 Ports to operate the double CIF automatically.
  • Motorized angle set using histogram inspection.
  • The reflectivity levels are calibrated to refractive index units (µRIU) for referencing purposes.
  • Calibrate, Reference, Align, Zero and Export (CRAZE) software to streamline the data.
  • Export to Scrubber software or any other commercial analysis software for calculating the rate constants. 

Relevant Literature References

R. Karlsson, P.S. Katsamba, H. Nordin, E. Pol, D.G. Myszka, Analyzing a kinetic titration series using affinity biosensors, Anal. Biochem. 349 (2006) 136–147.

W. de Lau, et al., Lgr5 homologs associate with Wnt receptors and mediate Responding signaling, Nature 476 (2011) 293–297. 

Rich R.L. Myszka D. Survey of the year (1999 upto 2011) optical biosensor literature. J.Mol.Recognit. See https://www.sprpages.nl/reviews/surveys. 

R.B.M. Schasfoort (Ed.), Handbook of Surface Plasmon Resonance, Royal Society of Chemistry, London, 2017. 

R.B.M. Schasfoort, et al., "Method for estimating the single molecular affinity.", Anal. Biochem. 421 (2012) 794–796, 2. 

R.B.M. Schasfoort, et al., Interpolation method for accurate affinity ranking of arrayed ligand–analyte interactions, Anal. Biochem. 500 (2016) 21–23. 

P. Schuck, H. Zhao, The role of mass transport limitation and surface heterogeneity in the biophysical characterization of macromolecular binding processes by SPR biosensing, in: Methods in Molecular Biology vol. 627, Springer protocols, 2010, pp. 15–54. 

B. Watts, K. Cronin, Guide to Running an SPR Experiment Version 1.3, Duke Human Vaccine Institute Biomolecular Interaction Analysis Core Facility. 4. Lower Surface Density (Rmax = 100-150 RU) for Kinetic Titration, 2022. 

H. Zhao, L.F. Boyd, P. Schuck, Measuring protein interactions by optical biosensors, Curr. Protoc. Protein Sci. 88 (1) (2017) 20–22.