Diagram
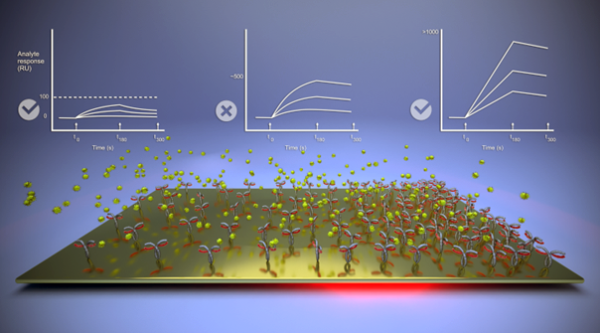
The instrument captures the images in real-time during analyte binding. The result is that at hundreds of regions of interest the binding curves are measured and analyzed. For equilibrium constants, the results are extrapolated to zero for scientific sound binding constants and the concentration is being measured at high ligand density under mass transport limited conditions. While the biphasic behaviour of antibody interactions are problematic to get reliable parameters, the monophasic interaction model fits the binding curves well close to zero ligand density. No specific expertise is required to run experiments.